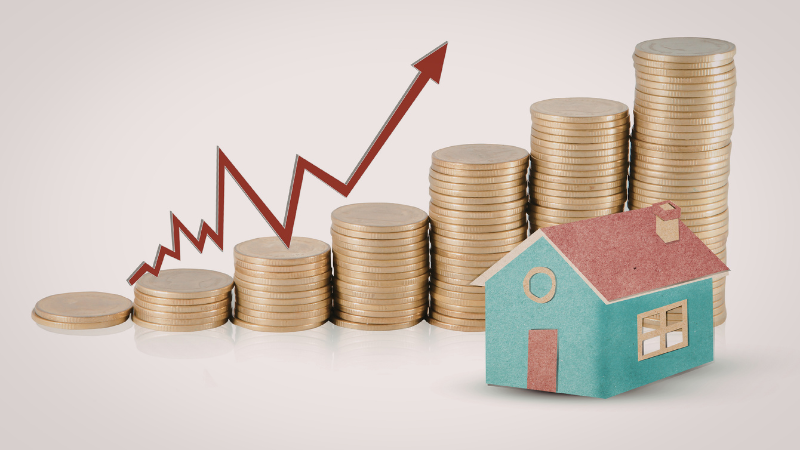
Quick answer: U.S. homes appreciate about 3%–5% per year on average over the long term.
If you want the real answer?
It depends on:
- Time horizon
- Location
- Market cycle
- Inflation
- Supply constraints
- Interest rates
- Leverage
This guide breaks down:
- 30-year historical appreciation data
- 2026 national trends
- Regional differences
- Inflation-adjusted returns
- Market crash periods
- Investment property appreciation
- How leverage multiplies gains
This is based on federal and institutional housing data — not headlines.
👉 If you’re building a rental portfolio and want to structure leverage intelligently, schedule a strategy call.
The Long-Term Average: 30+ Years of U.S. Housing Appreciation
According to the Federal Housing Finance Agency (FHFA) House Price Index (HPI), U.S. home prices have historically increased at approximately 4.3% annually (1975–2025 long-term average)
The S&P CoreLogic Case-Shiller National Home Price Index, which tracks repeat home sales across major U.S. metro areas, shows similar long-term growth patterns.
Over time, housing appreciation has:
- Outpaced inflation modestly
- Remained less volatile than equities
- Followed long cycles of expansion and correction
2026 Home Appreciation Data
As of early 2026:
- National home prices are rising in the 3%–6% annual range
- Inventory remains constrained in many metros
- Mortgage rate volatility has moderated
- Demand remains supported by demographic trends
The National Association of Realtors (NAR) reports continued price stability and moderate year-over-year growth following the 2020–2022 surge.
The explosive double-digit growth of 2021–2022 has normalized.
But appreciation remains positive nationally.
Appreciation by Market Cycle
Real estate does not move in a straight line.
Here’s how appreciation has behaved historically:
Expansion Cycles
- 1991–2006: Sustained growth
- 2012–2019: Recovery and expansion
- 2020–2022: Pandemic-driven surge (10–20%+ in many markets)
Correction Periods
- 2008–2012: National peak-to-trough decline of roughly 20–30%
(Case-Shiller data)
Despite downturns, long-term appreciation has remained positive. Real estate rewards time in the market — not timing the market.
How Inflation Impacts Home Appreciation
The U.S. Bureau of Labor Statistics (BLS) shows that long-term inflation has averaged roughly 2%–3%.
If housing appreciates at 4% annually and inflation averages 2.5%, that implies: Real (inflation-adjusted) appreciation of ~1.5% per year long term.
However:
- Leverage amplifies real returns
- Rent growth compounds wealth
- Principal paydown adds forced equity
Appreciation is just one piece of total return.
Regional Appreciation Differences
National averages hide local volatility.
According to FHFA regional HPI data:
- Sun Belt markets (Florida, Texas, Arizona, Carolinas) have outperformed in recent years.
- Midwest markets often show steadier but slower growth.
- High-tax migration-out states have experienced more volatility.
Real estate appreciation is hyper-local. The correct question isn’t just “How much do houses appreciate?”
It’s: How much do houses appreciate in the market I’m buying?
How Much Do Investment Properties Appreciate Per Year?
Investment properties typically follow broader market trends. However, investors can increase appreciation through:
- Value-add renovations
- Forced equity strategies
- Strategic acquisitions below market value
- BRRRR cycles
In many cases, investors accelerate appreciation beyond market averages.
How Leverage Multiplies Appreciation
This is what most “appreciation” articles ignore.
Example:
- Purchase price: $500,000
- Down payment: 20% ($100,000)
- Annual appreciation: 5%
- New value after 1 year: $525,000
- Equity gain: $25,000
That’s 25% return on cash invested before cash flow or principal paydown. This is why financing structure matters.
If you’re scaling rental properties, appreciation + leverage becomes exponential.
👉 See how DSCR loans allow investors to scale without personal income limits
Do Houses Always Appreciate Every Year?
No, short-term volatility happens.
Historical examples:
- 2008 financial crisis
- Regional oil market collapses
- Overbuilt condo markets
But over long holding periods (10+ years), national appreciation trends have historically remained positive.
Appreciation vs Cash Flow: What Matters More?
For investors:
- Appreciation builds equity.
- Cash flow builds income.
- Principal paydown builds forced equity.
- Inflation reduces the real debt burden.
The strongest portfolios combine all four.
If your financing restricts scaling, you cap appreciation upside.
Home Appreciation: Strategic Takeaway
So, how much do houses appreciate per year?
Historically:
- 3%–5% nationally over the long term
- 4.3% long-run average per FHFA data
But appreciation alone doesn’t create wealth; you need:
- Structure
- Leverage
- Time
If you’re investing in 2026, your financing strategy should allow you to:
- Capture appreciation
- Scale portfolios
- Avoid DTI bottlenecks
- Recycle equity efficiently
👉 If you’re using rental income to grow long-term equity, explore your investor financing options
- Built for investors.
- Structured for scale.
- Designed around cash flow — not W2s.
Defy the traditional.
FAQ: Home Appreciation
What is the average home appreciation rate over 30 years?
Approximately 4% annually, according to FHFA and Case-Shiller long-term data.
Is 5% appreciation realistic?
Yes. Many long-term national averages fall between 3% and 5%, though local markets vary.
Do houses appreciate faster than inflation?
Historically, modestly. Real appreciation typically averages around 1%–2% above inflation.
Can appreciation create wealth without cash flow?
Yes, but cash flow reduces risk and increases holding power during downturns.
What markets appreciate the fastest?
Markets with strong population growth, job expansion, and supply constraints tend to outperform.
